Options
Refine your selection
Distribution of full data set
This plot shows the distribution of data for the full dataset you have selected. Height of bars indicates the percentage of the datapoints in that group. Ticks near the x-axis represent individual points.
Probability plot of data set
The data will lie close to the 45 degree line if it is log-normally distributed (or normally distributed for temperature, pH and dissolved oxygen)
Data breakdown by landuse grouping
The spread of the data is shown for each grouping and for the full dataset at the top. Notches on the boxes that do not overlap each other indicate significant differences between groups. Note horns or lugs on the end of boxes indicate where notches extend outside the edge of the box - see About this tool for why this occurs.
Data breakdown by geographic region
The spread of the data is shown for each grouping and for the full dataset at the top. Notches on the boxes that do not overlap each other indicate significant differences between groups. Note horns or lugs on the end of boxes indicate where notches extend outside the edge of the box - see About this tool for why this occurs.
Data breakdown by the water type sampled
The spread of the data is shown for each grouping and for the full dataset at the top. Notches on the boxes that do not overlap each other indicate significant differences between groups. Note horns or lugs on the end of boxes indicate where notches extend outside the edge of the box - see About this tool for why this occurs.
Data breakdown by the flow conditions when sampled
The spread of the data is shown for each grouping and for the full dataset at the top. Notches on the boxes that do not overlap each other indicate significant differences between groups. Note horns or lugs on the end of boxes indicate where notches extend outside the edge of the box - see About this tool for why this occurs.
Statistics
Metadata
About Urban Runoff Quality Information System
URQIS is a resource developed in 2012 that provides stormwater and urban stream quality data to the public by accessing a database of urban runoff quality data collected from all over New Zealand, compiled by NIWA. The database includes data supplied by Councils, Transport Agencies, Research Institutes and Universities across New Zealand. The development of URQIS has been funded by NIWA's Freshwater and Estuaries National Centre and Auckland Council's Stormwater Team.
Use of this website is subject to our terms and conditions of use.
Information on the statistical analyses provided.
Statistical approach for urban runoff data with data below detection
Sometimes urban runoff quality monitoring data include values that are below the laboratory reporting level, or limit of detection, for example <2 mg/L, also known as censored data. The statistical outputs use a method designed for censored data, called robust regression on order statistics (robust ROS, see Helsel (2012) for details). Briefly, uncensored (above detection) sample data are used to plot a distribution of the data and this distribution is used to impute (estimate) values for the censored (below detection) data points. Plots and summary statistics can then be calculated from the combined set of uncensored and imputed data. This method produces reliable results for small (n = 20) and moderate (n = 50) sized data sets (Helsel 2012).
Summary Statistics
The robust regression on order statistics method is used to produce these summary statistics. In some cases there is insufficient data to adequately model the regression and statistics are not calculated when the number of samples is 3 or less. When almost all data (>90%) is censored (below detection) a regression cannot be modelled and again statistics are not calculated.
N: The total number of data points in the data set, including censored data.
N censored: The number of censored (less than the laboratory reporting level) data points in the data set.
% censored: The percentage of censored data points in the data set. If this is greater than 80%, the summary statistics have low reliability.
Median: The middle value or 50th percentile - 50% of the data in the data set will be above this value and 50% will be below.
Mean: The arithmetic mean of the data. For urban runoff this is commonly higher than the median due to the log-normal distribution of the data.
Standard deviation: This shows how the variation or dispersion from the mean. A large standard deviation indicates a wide range in the values and a small standard deviation indicates all data is similar to the mean.
25th and 75th percentiles: The 25th and 75th of N ordered values (arranged from least to greatest) obtained by first calculating the ordinal rank, rounding the result to the nearest integer, and then taking the value that corresponds to that rank. Also known as the 1st and 3rd quartiles.
Histograms
A histogram is graphical representation of the distribution or spread of the data, which indicates the central tendency, range and skewness. A density plot is overlain and shows a smoother line for the distribution. A rug plot draws a tick for every value and is shown at the bottom of the histogram. For this graphic, censored data is plotted at half the laboratory reporting level.
Normal Probability Plots
The normal probability plot shows graphically whether or not the data is log-normally distributed; or normally distributed for the cases of pH, temperature or dissolved oxygen. A straight line at 45° angle indicates log-normal (or normal) distribution. In the plot censored data are shown as open circles and are always plotted on the log-normal line. The number of censored data and uncensored data are shown in the legend.
Box Plots
Box and whisker plots indicate the spread of the data and allow a graphic comparison between groups. The modelled data from the regression on order are used to produce these plots to ensure consistency with the summary statistics.
In some cases there is insufficient data to adequately model the regression. Box plots are not drawn when the number of samples is 3 or less. When almost all data (>90%) is censored (below detection) a regression cannot be modelled and again a box plot will not be drawn.
A band in the middle of the box indicates the median concentration. Left and right bounds of the box indicate the 25th (lower) and 75th (upper). Whiskers extend to the nearest data points that are within 1.5 times the inter-quartile range (IQR) of the median value. Data points lying outside this range (outliers) are shown as individual points.
The boxes also have "notches" which indicate the confidence interval for the median. These are calculated as ± 1.58 x IQR/sqrt (n) where n is the number of samples (R Development Core Team 2010). In some situations, the notches extend beyond the hinges of the box. This indicates that the confidence interval, which is symmetric, is greater than the IQR, which is typically asymmetric for these data.
References
Helsel, D. (2012). Statistics for Censored Environmental Data Using Minitab and R, 2nd Edition. Wiley. 344p. ISBN 978-0-470-47988-9
R Development Core Team (2012). R: A language and environment for statistical computing. R Foundation for Statistical Computing, Vienna, Austria. ISBN 3-900051-07-0, http://www.R-project.org.
How the data is categorized
Water type categories
Urban streamsA continuously or intermittently flowing waterway that may be natural or modified, and does not include artificial watercourses such as open stormwater channels.Untreated stormwaterWater contained within a reticulation network (generally a pipe network but may include some open channels such as swales) and is not subject to any form of quality treatment.Treated stormwaterWater contained within a reticulation network (generally a pipe network but may include some open channels such as swales) and is not subject to any form of quality treatment.
Event type categories
Storm event (high flows)Samples were collected during a rainfall event or when stream flows were at a high level due to storm water (quickflow) inputs.Between event (low flows)Samples were collected during dry weather, when stream water was dominated by seepage and groundwater inputs.All flow conditionsData tagged as storm event, baseflow and unknown. "Unknown" is data supplied with no information on the flow conditions during sampling.
Region categories
The geographic regions of New Zealand, as defined by the regional council boundaries
Data categories
The data supplied has been evaluated using a set of criteria to differentiate between data collected using field and laboratory procedures with high quality assurance. Users can choose an option to base selections on high quality data only.
Landuse categories
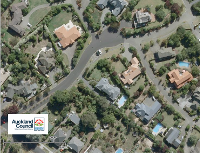
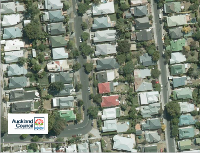
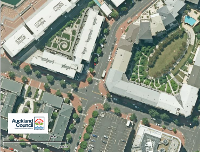
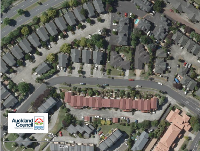
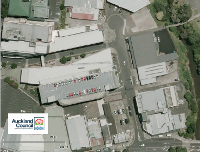
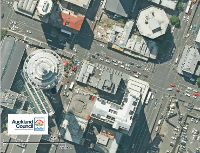
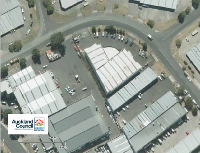
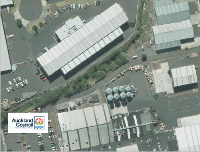
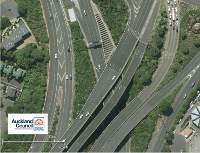
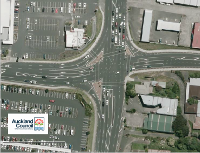
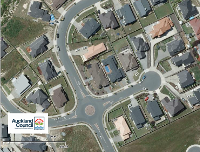
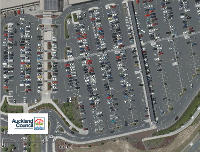
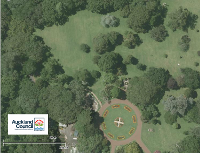
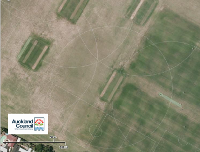
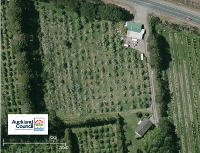
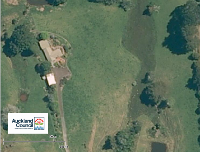
The urban runoff data in URQIS is categorised according to the land use type in the generating catchment. Descriptions and example aerial photos are shown below for the different landuse types.
| Residential categories | Description | Aerial photo example (all at the same scale) |
|---|---|---|
| Low density | Quarter acre sections. Etimated 8-11 dwellings per hectare |
|
| Medium density | Colonial villas and/or modern houses on small sections, infill and crossed leased sections. Estimated 14-20 dwellings per hectare |
|
| High density | Flats, townhouses and apartments. Estimated 25-30 dwellings per hectare |
|
| Commercial and industrial categories | Description | Aerial photo example (all at the same scale) |
|---|---|---|
| Commercial | Malls, shopping streets etc. Main characteristic is high imperviousness due to parking, roofs and roads. |
|
| CBD | High rise buildings in central city including apartments, office blocks and high street department stores and arcades. |
|
| Light industrial | Warehousing, storage yards and light manufacturing. Land mainly covered by flat roof buildings and parking. |
|
| Heavy industrial | Shipyards, foundries, fertiliser manufacture etc. More outdoor area, fewer buildings, more high risk activities. |
|
| Road categories | Description | Aerial photo example (all at the same scale) |
|---|---|---|
| Roads > 20K vpd | Motorways and highways |
|
| Roads 5K-20K vpd | Major arterial roads |
|
| Roads < 5K vpd | Quiet suburban streets |
|
| Carparks | Parking lots, e.g., supermarkets, malls, arenas etc. |
|
| Pervious land categories | Description | Aerial photo example (all at the same scale) |
|---|---|---|
| Grassed open-space | Parks and playing fields. |
|
| Rural | Agriculture, horticulture, viticulture, pastoral and arable land |
|
Terms and Conditions
- The Urban Runoff Quality Database (Database) is provided jointly by the National Institute of Water & Atmospheric Research Ltd, a Crown Research Institute established in accordance with the Crown Research Institutes Act 1992 and the Auckland Council, (together, the Providers). The Providers make the Database available for the purpose of disseminating to the public certain information including data collected in relation to stormwater quality (Information).
-
While the Providers have used all reasonable endeavours to ensure the accuracy of the Information provided in the Database, the user acknowledges and agrees that the Information is provided "as is" without warranties of any kind, either express or implied, including as to accuracy, completeness, correctness, timeliness or fitness for any particular purpose. Accordingly, the Providers do not give, and the user acknowledges and agrees that the Providers have not given, any representation or warranty that:
- the Information contains no errors, is complete or up-to-date; or
- he Information may be used for any particular purpose, or give any particular results or outcomes; or
- the flow or provision of the Information from the Providers will not be interrupted for whatever reason, or be available at particular times; or
- the Information or associated intellectual property will not infringe any third party's intellectual property rights.
- In addition, the Information shall in no way be construed to constitute a recommendation by the Providers to take (or not to take) any specific action. The user acknowledges that it assumes the sole risk of assessing, evaluating, interpreting and applying the Information.
-
The user acknowledges and agrees that while the Information is provided freely by the Providers:
- the user will use the Information only as provided;
- the user will only use the Information for lawful purposes;
- the user will not modify any Information in any way;
- the user will not use the Information to host all, or part(s), of any database via a website that is not owned by the Providers; and
- all proprietary rights (including all intellectual property rights) in, or associated with the Information are, and shall remain, vested solely in the Providers (or any other relevant third party who has contributed Information for which the Providers act as custodian).
- The Providers accept no liability for any loss or damage (whether direct or indirect) incurred by the user or any other person through their use of the Database or use, reference to, reliance on or possession of the Information. This shall include any interference with or damage to a user's computer system, software or data occurring in connection with or relating to the Database or its use. Users are encouraged to take appropriate and adequate precautions to ensure that whatever is selected from the Database is free of viruses or other contamination that may interfere with or damage the user's computer system, software or data.
-
The Providers reserve the right to cease to provide the Database or to remove all, or part(s), of the Information from the Database.
- Environment Canterbury
- Environment Southland
- Greater Wellington Regional Council
- Integrated Waste Solutions Limited
- Kaikoura District Council
- Nelson City Council
- Northland Regional Council
- NZTA, New Zealand Transport Agency
- Otago Regional Council
- Taranaki Regional Council
- Tauranga City Council
- Waikato Regional Council
- West Coast Regional Council